
Drone Thermography
Catch the defects the eye can't, by scanning them all. We scan every module of a large plant in a short time to quantitatively select hot-spots, bypass-diode faults, string breaks and other defects hard to spot by eye.
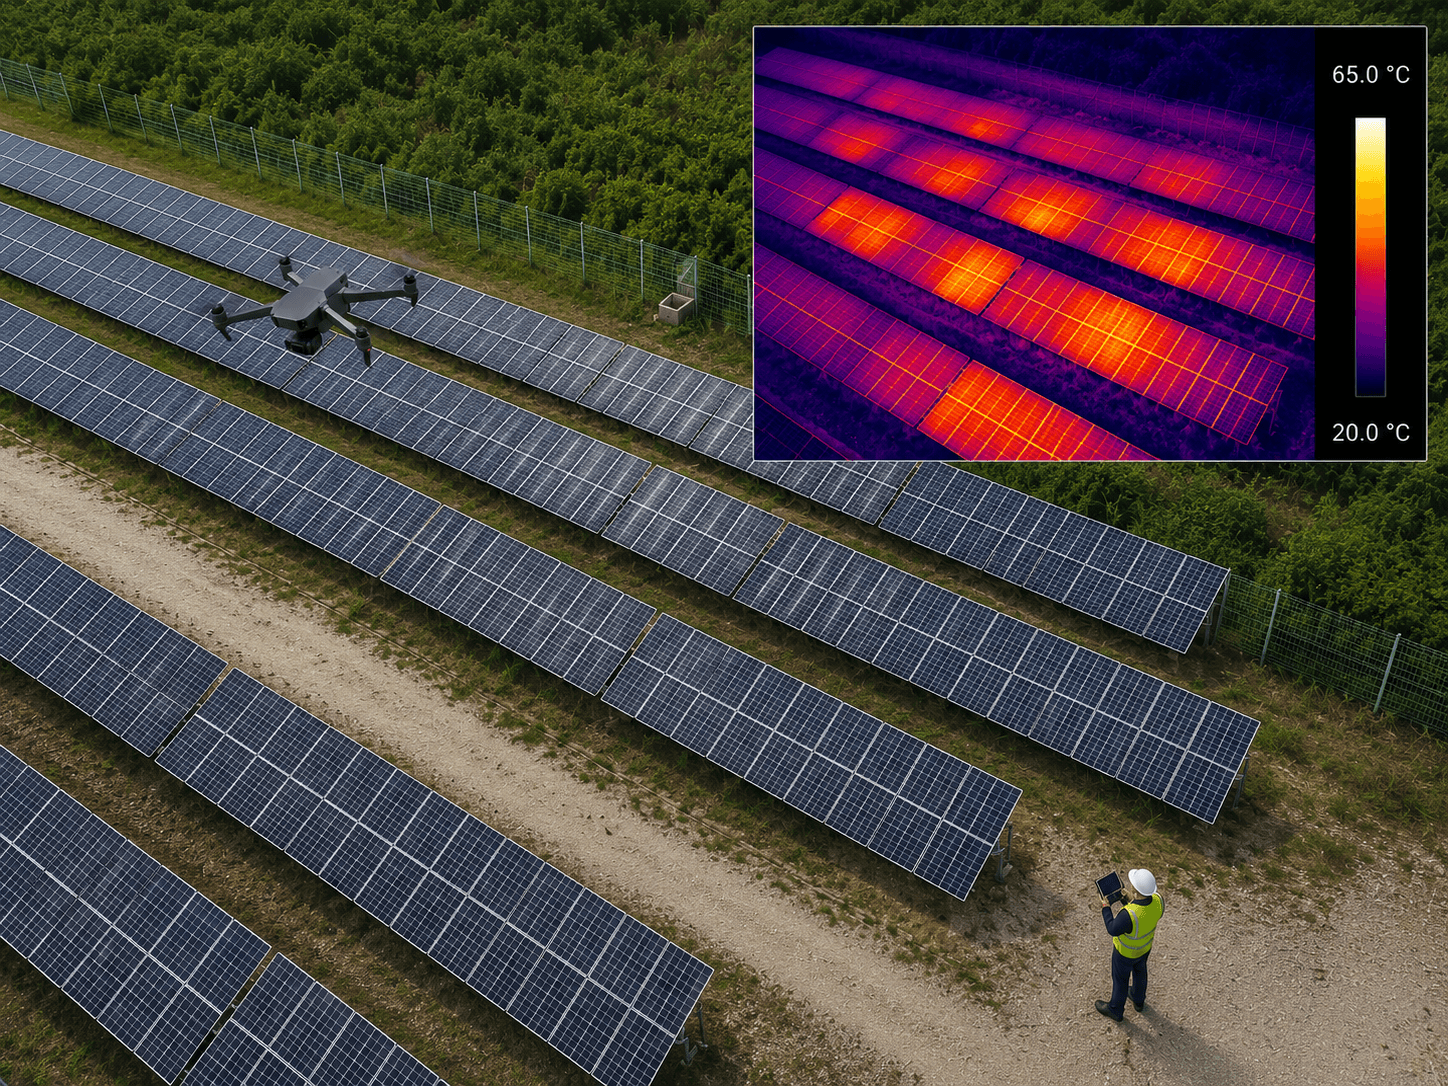
A full scan means zero missed defects.
Every module scanned
Not a sample — every module scanned without gaps in a short time.
Hot-spot, break, bypass
Hot-spots, bypass-diode faults and string breaks selected quantitatively.
Shading & loss analysis
GIS-based location analysis diagnoses the source of shading and losses in data.
What's included
Full module imaging
A single flight collects images of every module across the entire plant.
Hot-spot precision selection
Quantitatively classify defective modules from thermal heat patterns.
Defect-type diagnosis
Select hot-spots, bypass-diode faults and string breaks by type.
GIS-based shading analysis
Analyze location-based shading and the source of losses with GIS.
Layout-drawing consistency check
Verify that the actual installed layout matches the drawings.
Full-scan diagnostic report
A report with full imagery, defect selection, GIS shading and drawing consistency.
Onboarding process
- Step 01
Inquiry & consultation
Confirm plant location and size and arrange the flight schedule and airspace approval.
1-2 days - Step 02
Info & drawing review
Review plant info and drawings to fix the imaging scope.
1-2 days - Step 03
On-site flight & full imaging
Image every module in a full scan by drone flight.
1 day - Step 04
Analysis & diagnostic report
Analyze thermal, GIS and consistency data and deliver the diagnostic report.
2-3 days
Not a sample — every module.
Full scan
Diagnose every module — not a sample — in a short time.
Quantitative selection
Classify defective modules with data, not by "suspicion."
Linked with O&M & pre-inspection
Beyond standalone diagnostics, it integrates as a precision diagnostic tool within O&M Premium and pre-inspection Premium.
Data capability
Combining GIS shading analysis, drawing consistency and long-term monitoring data.
Frequently asked questions
What defects can you find?
Can I get it standalone?
Does it work for large plants?
How do I receive the results?
Related services
Catch the defects the eye can't, by scanning them all.
Tell us your plant location and size and we'll recommend an imaging schedule and diagnostic scope.